filter
Filtering of localizations
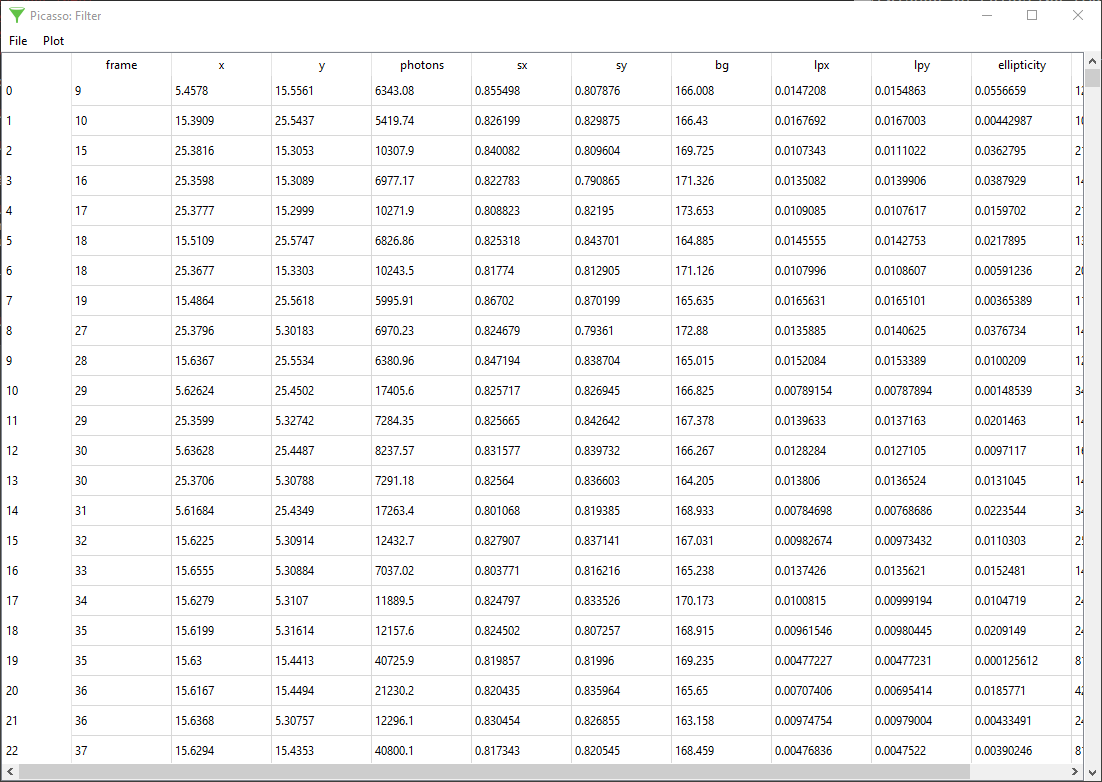
Open a localization HDF5 file in Picasso: Filter by dragging it into the main window or by selecting File > Open. The displayed table shows the properties of each localization in rows. Each column represents one property (e.g., coordinates, number of photons); see the filetypes section for details.
The columns are explained elsewhere in the documention for localizations, molecular maps and pick properties.
To display a histogram from values of one property, select the respective column in the header and select Plot > ‘Histogram’ (Ctrl + h). 2D histograms can be displayed by selecting two columns (press Ctrl to select multiple columns) and then selecting Plot > 2D Histogram (Ctrl + d).
Left-click and hold the mouse button down to drag a selection area in a 1D or 2D histogram. The selected area will be shaded in green. Each localization event with histogram properties outside the selected area is immediately removed from the localization list.
In Picasso 0.5.0, an alternative approach was introduced: In the menu bar, click Filter > Filter. A dialog is displayed where the user can numerically filter values for any of the columns. Click the Filter button in the dialog to remove localizations which do not fit in the input parameters.
In Picasso 0.9.5, a new plot was added to test for ‘subclustering’ and can be applied to molecular maps/cluster centers which save the column n_events, i.e., the number of binding events detected per molecule. The premise is the following: A single molecule is expected to give rise to a certain distribution of the number of binding events. If extra molecules are assigned, the number of binding events per molecule will on average be lower than the distribution would predict. Thus, by comparing the distribution of the number of binding events per molecule for two populations (clustered vs. sparse), one can assess whether subclustering has occurred. To plot the two distributions, use Plot > Test subclustering. The dialog allows the user to set the maximum nearest neighbors distance between molecules to be considered as clustered (“Max. dist. between clustered molecules (nm)”) and the minimum nearest neighbor distance for sparse molecules (“Min. dist. between sparse molecules (nm)”). The numbers of events for the two populations can be saved to a CSV file by checking the Save values checkbox before clicking the Test subclustering button.
The filtering information is stored in the metadata .yaml file. Picasso: Filter allows the user to load the filtering steps from previously filtered data by clicking Filter > Apply filters from metadata. The extracted information is displayed to the user before approval.
Save the filtered localization table by selecting File > Save.